Riemann Sums
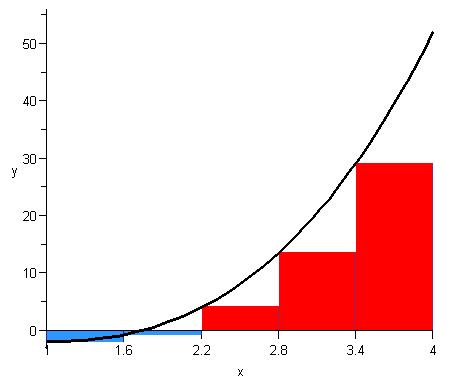
| Selection points: right-hand endpoints Riemann Sum: 58.8 | |
 |
|
| Selection points: left-hand endpoints Riemann Sum: 26.4 | |
| Selection points: midpoints Riemann Sum: 40.575 | |
Riemann Sums | |||
| The figures below display the graph of y = x3 - 3x together with the rectangles used to compute the Riemann sum corresponding to a regular partition of [1,4] into 5 subintervals and various selection points. The value of the Riemann sum is the red area minus the blue area. | |||
| |||
| |||
| |||