A Few Computer Generated Graphs |
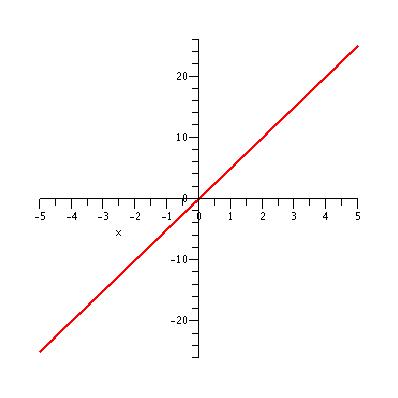 |
| The graph of y = 5x + sin(1000 Pi x)/100 Pi for x in the interval [-5, 5].
|
|
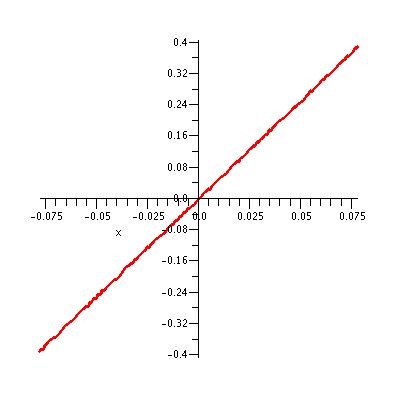 |
| The graph of y = 5x + sin(1000 Pi x)/100 Pi for x in the interval [-5/64,
5/64]. Is the ''noise'' on the graph real or an artifact of computation?
|
|
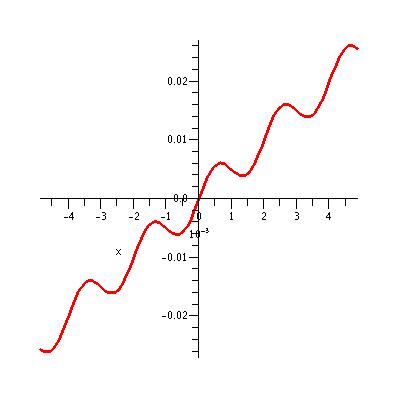 |
| The graph of y = 5x + sin(1000 Pi x)/100 Pi for x in the interval [-5/1024,
5/1024]. At this magnification it becomes apparent that the behavior hinted at in the previous graph is probably meaningful.
|
|
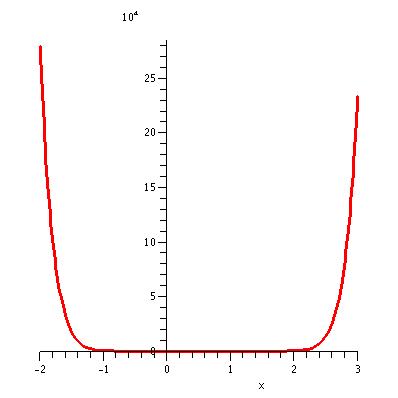 |
| The graph of y = (x/6 (9x - 5) (x-1))4 for x in the interval [-2,
3]. Notice that the units on the y-axis are multiples of 104.
|
|
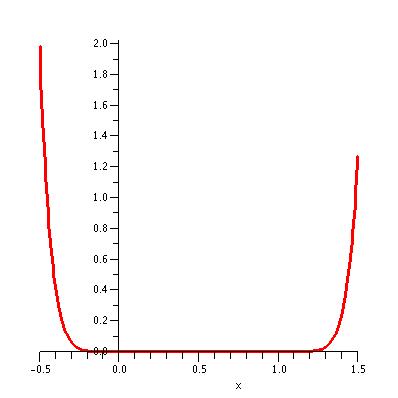 |
| The graph of y = (x/6 (9x - 5) (x-1))4 for x in the interval [-0.5,
1.5]. In this case the units on the y-axis are simply multiples of 1.
|
|
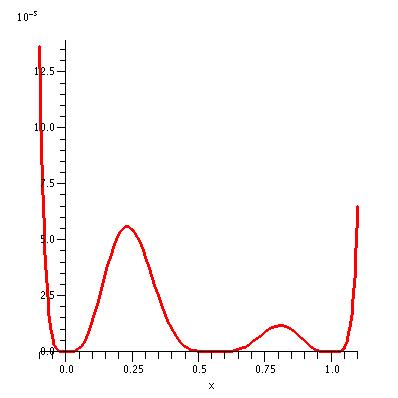 |
| The graph of y = (x/6 (9x - 5) (x-1))4 for x in the interval [-0.1,
1.1]. This time the units on the y-axis represent multiples of 10-5. At this magnification we see that the
''flat'' region in the two previous graphs isn't really flat at all!
|
|
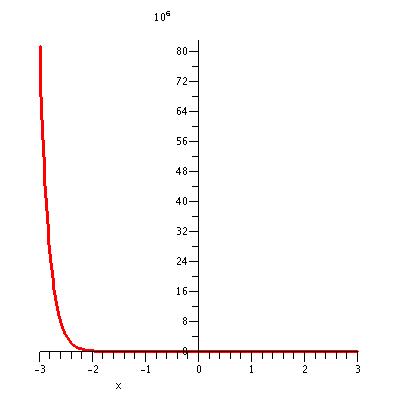 |
| The graph of y = (2x + 1)2 e-5x for x
in the interval [-3, 3]. Notice that the units on the y-axis are multiples of 106.
|
|
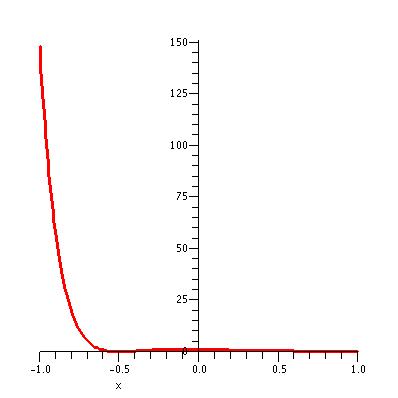 |
| The graph of y = (2x + 1)2 e-5x for x
in the interval [-1, 1]. Notice the change in scale on the y-axis and also that that the graph no longer appears to be perfectly
flat near x = 0.
|
|
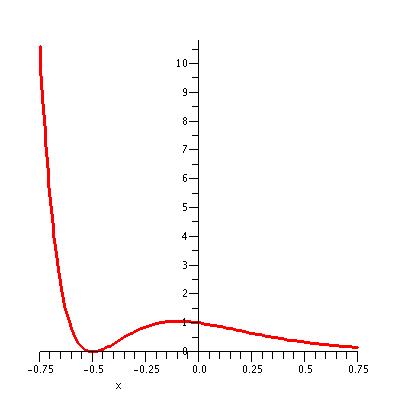 |
| The graph of y = (2x + 1)2 e-5x for x
in the interval [-0.75, 0.75]. Once again, after sufficient magnification we find that the tremendous scale of the first graph
completely obscures an interesting feature of this function.
|
|