Limits of 2-Variable Functions
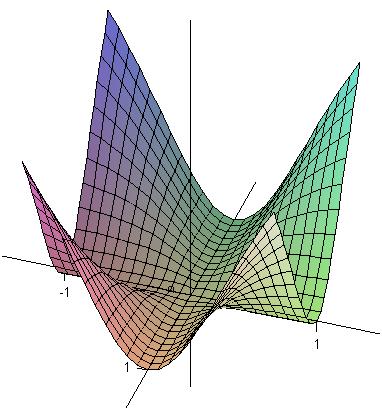 |
| Graph of the function f(x,y) = x2y2/(x2
+y2), suggesting that the limit of f(x,y) as (x,y) --> (0,0) exists. |
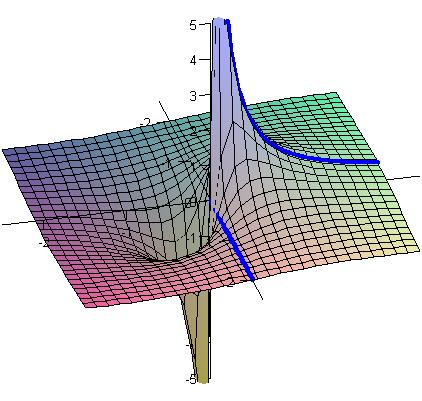 |
| Graph of the function y/(x2
+y2). The blue contours indicate what happens as we approach (0,0) on this graph along the positive x- and y-axes. |
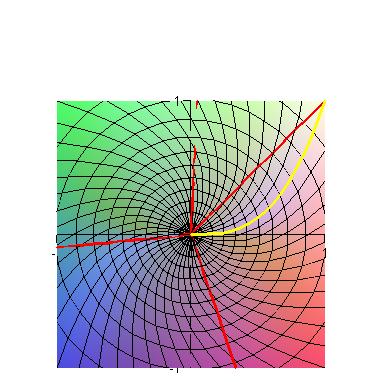 |  |
| The left-hand image shows several lines and one cubic curve
(y = x3) approaching the origin. The right-hand image shows the images of these curves on the graph of x3y/(x6 + y2). The cubic curve follows a ridge of height 1/2, whereas the straight lines eventually cross this ridge on their way to the origin. This explains why the limit of this function as we approach (0,0) fails to exist. | |